
The City of Las Cruces’ Sustainability Office helps organizations and residents balance economic vitality, environmental health, and social responsibility. The office promotes many sustainability best practices with an emphasis on equitable approaches to addressing climate change, clean energy, and resiliency.
- Almost 53 percent of greenhouse gas emissions come from people driving around Las Cruces.
- New Mexico is one of the top three in the nation with the best solar energy resources.
- Green infrastructure uses nature’s service to collect stormwater in swales or depressions to help trees grow and recharge underground aquifers.
Contact Us
Jenny Hernandez – Sustainability Officer
Email Jenny Hernandez: [email protected]
Phone: (575) 541-2177
NMDOT Electrical Vehicle Information
The City of Las Cruces is inviting local businesses to partner on a joint application for the New Mexico Department of Transportation’s National Electric Vehicle Infrastructure (NEVI) funding. Interested businesses are invited to submit a brief narrative application to be considered as a host site.
This call is specifically for businesses that want to partner with the City. Selected partners will enter a site-use agreement with the City to jointly apply to NMDOT for NEVI funding to install public DC Fast Charging (DCFC) equipment.
This funding can transform eligible sites into convenient destinations for the growing number of EV drivers traveling along US-70 toward Alamogordo and I-10 from Las Cruces to the Texas state line. The program reimburses eligible costs, including commercial-grade DC fast charging equipment (minimum 150 kW per port), installation and labor, permitting and engineering, utility upgrades, five-year warranty and maintenance, signage, shipping, and third-party inspections.
To be considered, applicants must submit a 1–2 page narrative (PDF) that addresses the items below. The City will score submissions and select the strongest sites to move forward in a joint application to NMDOT.
What to submit in your 1–2 page narrative:
- Business name, point of contact, email, and phone; confirmation you are incorporated in New Mexico or registered to do business here.
- Site address and a brief description of the location (visibility, proximity to major corridors such as I‑10/US‑70, access and circulation).
- On-site amenities available to the public (e.g., restrooms, food/coffee, retail, lighting hours) and typical hours of operation.
- Parking details showing how spaces can be dedicated to EV charging and remain publicly accessible 24/7.
- Readiness of electrical infrastructure (e.g., 480V three‑phase service available or feasible, available capacity/transformer info if known).
- Cellular service at the site and dusk‑to‑dawn lighting (existing or planned).
- Any known constraints (easements, ADA considerations, planned construction) and your willingness to host equipment via a site-use agreement.
- Why your site is a strong fit for fast charging (anticipated customer/vehicle traffic, nearby destinations, safety/visibility).
Minimum partner qualifications
- Public 24/7 access to the charging spaces.
- Ability to dedicate parking spaces for EV charging and support clear wayfinding/signage.
- Adequate cellular service and dusk‑to‑dawn lighting on the charging area.
- Feasible access to electrical utility service; willingness to coordinate site assessment with El Paso Electric.
- New Mexico incorporation or current registration with the NM Secretary of State to do business in the state.
Please review the entire application before submitting and read through NMDOT’s application.
How to submit and timeline:
Email your 1–2 page narrative (plus optional photos/ informal site sketch) to [email protected] with the subject line “NEVI Partner Site – [Your Business Name]” by 6 p.m. on Thurs., Nov. 24, 2025.
City review and scoring will be completed by December 1, 2025. Selected partners will be notified by December 5, 2025 to finalize a site‑use agreement.
The City will include selected sites in its NEVI application to NMDOT by December 31, 2025. If awarded by the state, the host site and the City will proceed with installation to meet program deadlines. Timelines are subject to change.
Questions? Contact the City of Las Cruces Sustainability Office at (575) 541-2177 or [email protected].

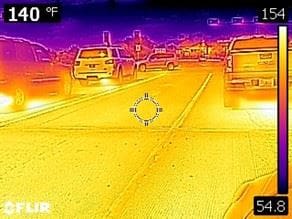
Urban Heat Islands occur in areas with large amounts of asphalt and concrete which raise surrounding air temperatures. Residents are affected outside and in their homes. Urban heat is caused by an increase in surfaces that absorb heat, not climate change.
According to a recent survey, more than 50% of Las Crucians are adversely affected by extreme heat. Paved streets can make summer temperatures feel like 140°F in summer afternoons.
MORE INFORMATION
As part of a NASA satellite study, a project team created an urban heat island map of Las Cruces with special overlays examining vulnerable populations.
NOAA and CAPA Strategies helped Las Cruces map urban heat patterns in the morning, afternoon, and early evening.
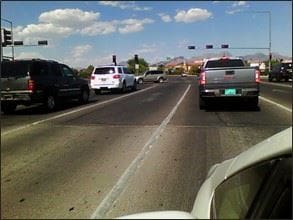
During periods of extreme heat, roadways and pedestrian paths in Las Cruces can exceed temperatures of 140°F. This infrared image and photo are taken from Lohman Avenue and Walton going east.

Climate change modeling indicates that Las Cruces can expect higher temperatures, more drought, periodic flash floods, and dust storms.
- Two weeks per summer of temperatures >105°F by mid-century and 8 weeks by the end of the century
- More than 50 days per year when warm temperatures and humidity in the monsoon season will make evaporative coolers ineffective.
MORE INFORMATION
Climate of Las Cruces CLIMAS Report
Watch climatologist Katherine Hayhoe describe climate modeling in Las Cruces below.

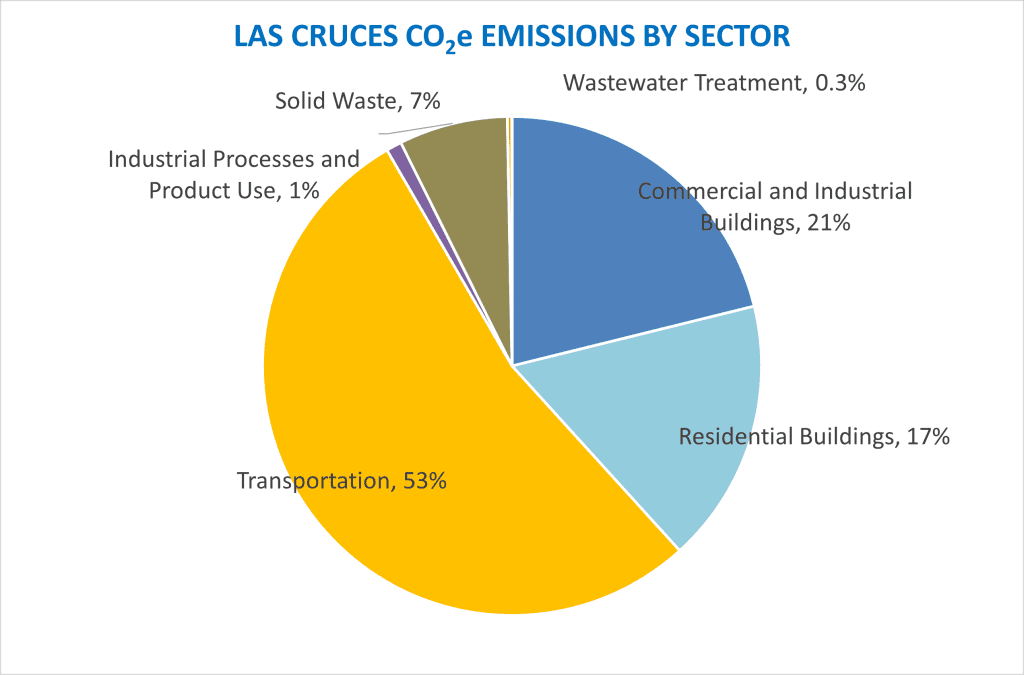
A 2018 citywide Las Cruces greenhouse gas (GHG) emissions inventory guided the City in setting emission reduction targets in the City’s first Climate Action Plan. It determined that:
- 53% of GHG emissions come from local transportation;
- 23% from commercial and industrial buildings;
- 17% for residential buildings; and
- 7% from solid waste.

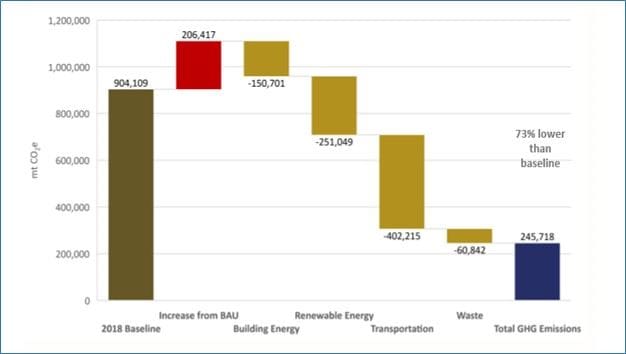
On October 5, 2020, The City adopted a citywide Climate Action Plan that set targets for GHG emission reductions, strategies, and requirements for the City to incorporate up-to-date climate science and projections into relevant City planning and policy decisions. Overall reduction target include:
- GHG emission reductions of 19% or greater (of 2018 baseline) by 2030;
- GHG emission reductions of 73% or greater (of 2018 baseline) by 2050;
Greenhouse Gas Emission Totals (mt CO2e) and Sector Impact
MORE INFORMATION
City of Las Cruces Climate Action Plan Report – July 2020
Transportation Sector
53% of greenhouse gas emissions in Las Cruces come from transportation. Improving current transportation standards and plans could greatly reduce our carbon footprint. Reduction Targets for this sector include:
- Promote electric vehicle adoption that is inclusive of the entire community by 22 percent by 2030 and 50 percent by 2050.
- Prioritize the development of active transportation by 12 percent by 2050 and 40 percent by 2050.
- Increase public transportation use by 15 percent by 2030 and 35 percent by 2050.
MORE INFORMATION
- Map of electric vehicle charging stations (planned for Feb 2021)
- Las Cruces Active Transportation Plan
Building Sector
Approximately 38 percent of greenhouse gas emissions in Las Cruces come from using electricity and natural gas in commercial and residential buildings. Building greenhouse gas emissions are reduced when occupants practice energy efficiency and use renewable energy. Targets for this sector include:
- Decarbonize energy in buildings by 6 percent by 2030 and 70 percent by 2050.
- Expand residential energy efficiency programs by 18 percent by 2030 and 65 percent by 2050.
- Reduce commercial building energy use by 30 percent by 2030 and 75 percent by 2050.
- Reduce energy usage in municipal buildings through efficiency and demand management by 25 percent by 2030 and 75 percent by 2050.
MORE INFORMATION
To learn more about the myths and facts about the cost of electric versus gas, air-source heat pumps, heat pump water heaters, induction stoves, impacts on the electric grid, and social equity read: It’s Time to Transition to Clean Electric Buildings.
If you would like a handout on how to select an electric appliance that qualifies for rebates or tax credits, contact [email protected]. We have information on duct or ductless air-source heat pump, heat pump water heaters, heat pump dryers, and induction stoves.
Renewable Energy Sector
Renewable energy whether solar, wind, biogas are a few the ways this area can transition to a sustainable supply of electricity in all sectors. The City received SolSmart Gold Certification for its excellent service, especially in inspections. Targets for this sector include:
- Increasing renewable energy adoption especially in low- and moderate-income households by 12 percent by 2030 and 28 percent by 2050.
- Almost 25% of the city’s electricity will come from on-site solar installations by 2021.
MORE INFORMATION
This time-lapse video shows how solar has grown in Las Cruces. As of June 2019, there were almost 1400 PV installations. Including the City government’s installations, there is more than 8 MW’s of clean solar energy generated by the government, businesses, and residents of Las Cruces.
Solid Waste Sector
About 7 percent of greenhouse gas emissions in Las Cruces come from solid waste. Adopting strategies such as composting helps to increase waste minimization. Targets for this sector include:
- Incentivize waste minimization by 25 percent by 2030 and 70 percent by 2050.

The Climate Action Plan looks at ways to reduce our carbon footprint and lessen the impacts of extreme weather events. Resiliency helps the community bounce back when the climate impacts stressors or shocks emerge.
Cooling Urban Infill Area
In the urban center, over 25 percent of families live below poverty; 33 percent of individuals over 65 live alone; and almost 2000 households are without vehicles. Over one-third of homeowners and over half of renters spend more than 30 percent of their gross income on their residence and utilities. (U.S. Census, 2017)
These neighborhoods are characterized by asphalt roads, narrow sidewalks, and cinderblock constructed homes with minimal energy efficiency measures and landscaping which can raise ambient temperatures by more than 10°F day and night. The city’s shade canopy covers less than 4% of its land area.
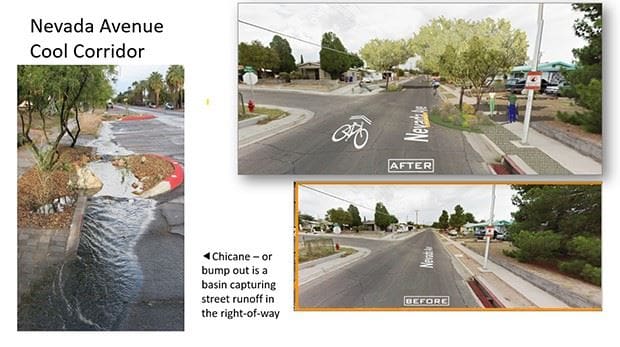
The Nevada neighborhood is representative of an area that is significantly impacted by urban heat island. This project establishes a mile-long green corridor that harvests rainwater, neighboring residential tree planting, and other community-driven projects in the Nevada neighborhood, a low/ moderate-income area.
Reimagine clean desert-scapes and a city free of plastic clutter. Reimagine the possibilities of our community doing their part and helping to protect our health and the environment in Las Cruces.
Plastics are harmful to our environment and contribute to polluting our land, air, and food. The City of Las Cruces is committed to reducing single-use plastics, starting in January 2022 plastic bags will not be available at most retailers. Without a reusable bag, retailers will be collecting ten cents for single-use paper bags. You can help to do your part by bringing a usable bag on your next shopping trip! Not only will you be helping to save our environment, but also money!
Let’s commit to a Greener, Cleaner, Cruces!
Facts
- On average, a plastic bag is only used for a total of 12 minutes.
- An average person ingests about a credit card’s worth of plastic each week.
- Littered bags are eaten by wildlife block their digestive system.
For those of you that want to dive deeper into your understanding of the impacts of plastics on health, wildlife, and the environment here are some excerpts and resources.
Why a Plastic Bag Ordinance?
Most plastic, single-use carry-out bags are harmful to both the environment and humans. Often these bags do not biodegrade and remain in the environment for years. It also contributes to the growing problem of litter and pollution, impacting the city’s tourism and aesthetics. It becomes in effect on January 1, 2022.
Who is Impacted?
All retail establishments in the City of Las Cruces. At this time, restaurants and nonprofit organizations will not be impacted at this time.
What Bags Are Still Allowed?
Laundry dry cleaning bags, door-hanger bags, newspaper bags, bags intended for waste, bags provided by pharmacists or veterinarians to contain medical items, bags used by consumers in retail establishments to contain bulk items or contain/wrap frozen foods, meat, or fish.
What Are Alternatives?
Anything can be a reusable bag! A used gift bag, an old purse or tote, even a diaper or gym bag!
Environmental Service Fee Remittance Form
A PDF copy of this form will be emailed to the email address entered above within 10 minutes of your submission. Please print out the PDF that you receive in your email inbox to turn in with payment.
